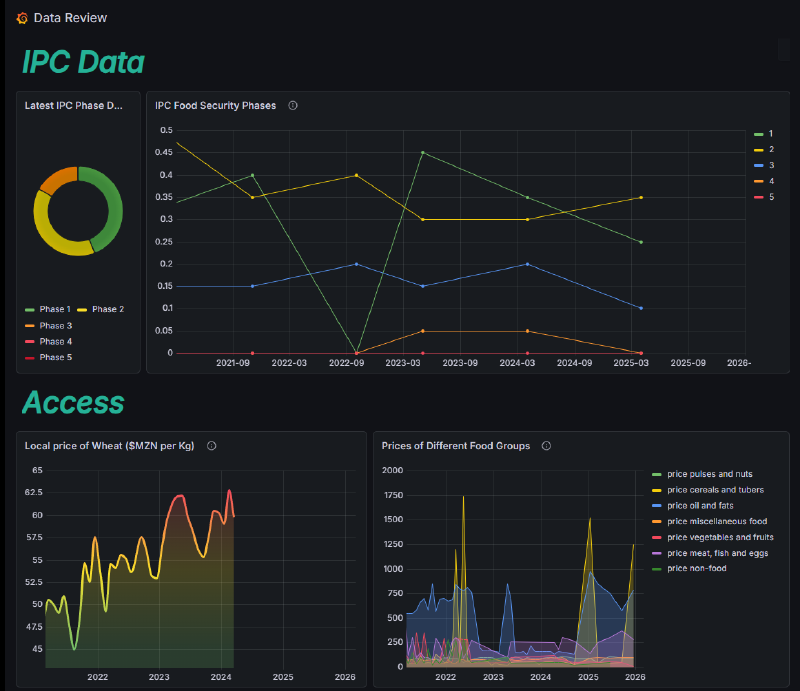
I’d like to write about the Food Security platform that I built, along with 4 other students. The task for the project was to build an open source intelligence platform & dashboard that provides graphical widgets that contain common indicators for causes of food security. The goal was to provide an early warning system for possibly projecting trends in food security, and making predictions on future trends on food security for specific countries.
Repurposing Common Technical Systems #
I was tasked with completing the technical infrastructure work for this project. The system itself is an AWS EC2 Ubuntu Instance, which is responsible for hosting all other systems & applications that are accessible by the end user. We went with an AWS instance because it allowed for central access to other students that required access to the host, it also provides a low risk threat environment for something that is being published to the public domain.
On this Ubuntu server, we hosted a Grafana application, which was receiving information from an SQL database. This Grafana server was then having the port translated through an Apache web proxy and hosted through the Apache web server out a standard HTTPS port. At the end of the project, our architecture looked like this:
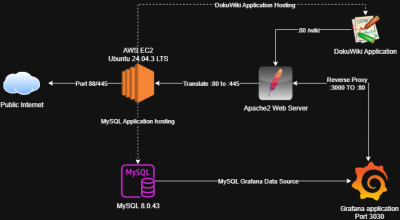
This provided architecture that was scalable while also providing simple manual control to achieve what we needed in a short timeframe (the system was created over the space of 5 weeks).
I really enjoyed utilizing Grafana for this project. Traditionally, it’s an application used for monitoring & incident response, but I’ve used it in the past and had an understanding on how we could apply it in this instance, through writing custom queries to call upon our data source and give nice clean outputs. On reflection, it wasn’t the most user-friendly application we could have worked with, but it’s open-source (fitting with our model & goal) and was simple to get up and running & manipulate.
The ETL Pipeline #
ETL, or Extract/Transform/Load is the process of fetching a piece of data, transforming it to meet a requirement, and loading it into a database. This was by far the most challenging and rewarding technical problem I had to solve as part of this project. The problem statement was that we have to fetch as much data as possible, and load it into our database in order to perform queries to create our analytics. Or simply, the more data we have available, the more outputs we can produce.
This can be done manually, but the physical overhead and man-hours required made it unfeasible in the short time-frame we had. The steps for data load were as follows:
- Get all API endpoints from a specific data source
- Fetch data columns of each API endpoint
- Dynamically create an SQL table in the database with correct types assigned
- Load API data into program memory
- Push API data from memory into the freshly-created table
- Feed into Grafana
After I found the libraries that could accommodate building this platform, the programming aspect was a lot of fun. By utilizing the Pandas function .is_<datatype>_dtype, the process of data mapping became simple:
def map_dtype(dtype):
    if pd.api.types.is_integer_dtype(dtype):
        return sql_types.INTEGER()
    elif pd.api.types.is_float_dtype(dtype):
        return sql_types.FLOAT()
    elif pd.api.types.is_datetime64_any_dtype(dtype):
        return sql_types.DATETIME()
    elif datetime_valid(dtype):
        return sql_types.DATETIME()
    else:
        return sql_types.VARCHAR(length=255)
This along with some simple API iteration and loading formed the basis of the mapping script. The loading behavior is then managed by an overarching control script, which was responsible for calling the upload script and managing on system data, accommodating scalability and simple re-runs through establishing system CRON jobs. The source code, and more information regarding the system, can be found at this GitHub repo.
What We Learned #
The project was a great introduction to building & managing an intelligence platform. It seemed as though our biggest pitfall was focusing on data & GUI design, and not designing for actionable insights. If I was going to go back to square-1, I would start the project by establishing a hypothesis, e.g. “Is Mozambique a region that shows trends of food insecurity?”. From here we can structure our data to prove this hypothesis through the utilization of a combination of Food Security assessment frameworks, as well as general purpose intelligence frameworks (such as Alternative Analysis and other Structured Analysis Techniques (SATs)).
For future projects, I’d like to use industry standard ETL pipelining techniques instead of throwing something together using the skills that I have now. This would allow to get things up and running quicker, allowing us to focus on building insights.